Jordi Sanfeliu
2016-02-15 17:17:19 UTC
Hello Elias,
way to proceed.
the following screenshot to get an idea of it:
<Loading Image... >
>
Multihost option is pending to have a complete rewrite which will
include numerous new features. I just hope to have enough spare time to
start developing its next version.
Hello Jordi,
I have installed Monitorix in a set of 5 Raspberrys and it works great
on each. It is a smart and useful tool. Thank you very much!!
You're very welcome, I'm glad to know you are enjoying Monitorix.I have installed Monitorix in a set of 5 Raspberrys and it works great
on each. It is a smart and useful tool. Thank you very much!!
I have more nodes to be added shortly.
1. I added a new custom graphic by copying one of the .pm modules,
renaming and modifying it to initialise, update and request the
information I needed.
I wonder if there is another default procedure that you would suggest
for adding custom graphs from custom data sources.
No, since there isn't any special procedure for this, that's the right1. I added a new custom graphic by copying one of the .pm modules,
renaming and modifying it to initialise, update and request the
information I needed.
I wonder if there is another default procedure that you would suggest
for adding custom graphs from custom data sources.
way to proceed.
2. I need to specify different graphs, other than the 'system load' for
multi server monitoring.
I copied the generated page into a static html and changed the URL to
request different graphs. This approach lacks some flexibility.
I would greatly appreciate if you can help me achieve multi server
monitor of any of the graphs.
The 'Multihost' feature should help you exactly on this. Please, checkmulti server monitoring.
I copied the generated page into a static html and changed the URL to
request different graphs. This approach lacks some flexibility.
I would greatly appreciate if you can help me achieve multi server
monitor of any of the graphs.
the following screenshot to get an idea of it:
<Loading Image...
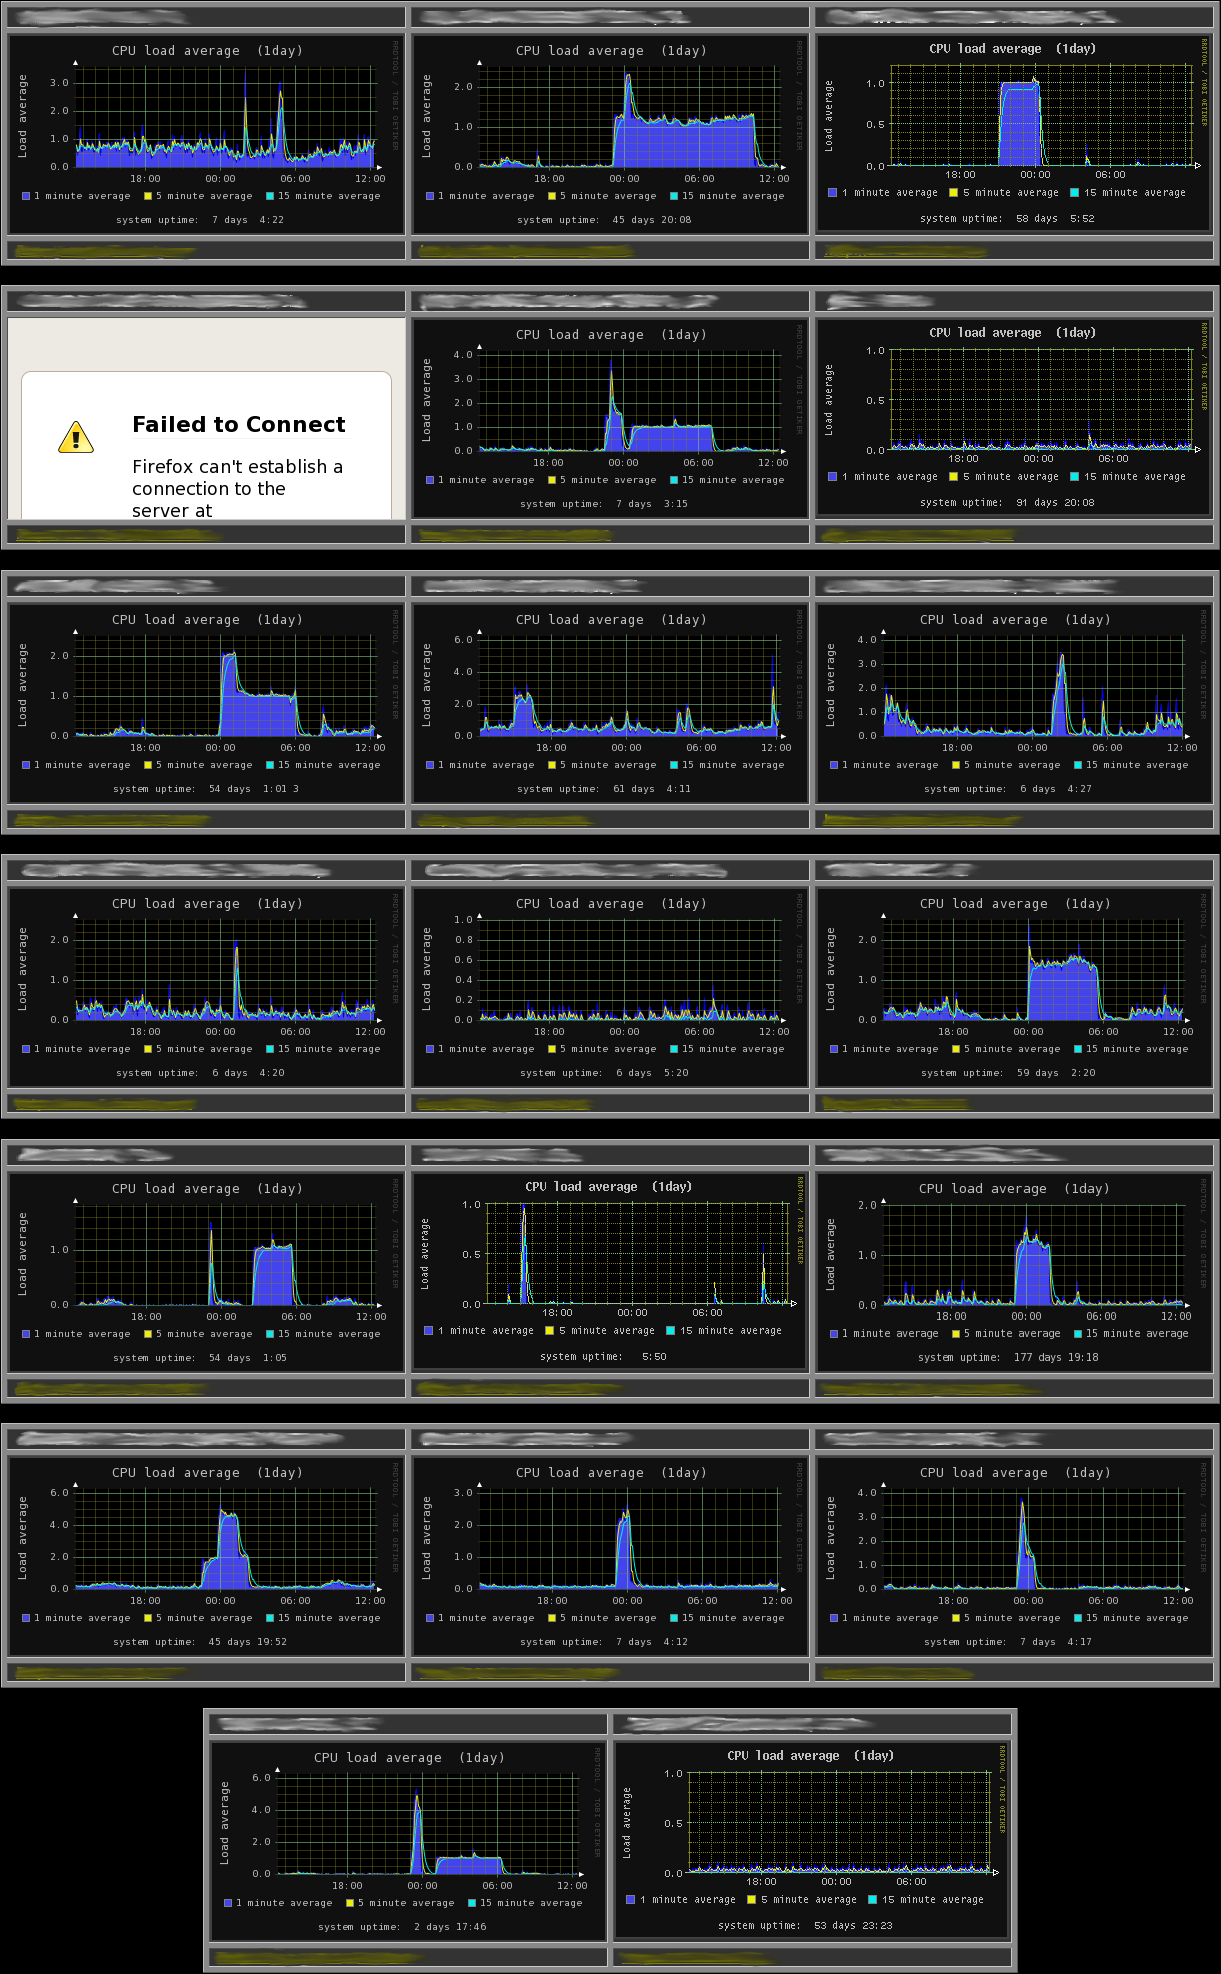 >
>Multihost option is pending to have a complete rewrite which will
include numerous new features. I just hope to have enough spare time to
start developing its next version.
As a side comment, one immediate insight I obtained from Monitorix is to
witness the huge performance difference between RPi B+ and RPi 2. The
later has 3x less kernel usage than the B+. Although I knew about the
difference and I have both models installed, I had not been able to have
such a clear comparison until now. Great!!! ....and this is just the
beginning....
Heh, that's great! :)witness the huge performance difference between RPi B+ and RPi 2. The
later has 3x less kernel usage than the B+. Although I knew about the
difference and I have both models installed, I had not been able to have
such a clear comparison until now. Great!!! ....and this is just the
beginning....
With my due respect and thankfulness,
Elias Crespin
Best regards.Elias Crespin
--
Jordi Sanfeliu
FIBRANET Network Services Provider
http://www.fibranet.cat
Jordi Sanfeliu
FIBRANET Network Services Provider
http://www.fibranet.cat